Buckle Up: How Surging Jet Fuel Prices are Reshaping Airline Fares

As travelers plan their next getaway, many are noticing a turbulent trend: the cost of a plane ticket is taking off. While several factors influence the final price, the most volatile driver in 2026 is the price of jet fuel.
Jet fuel is a fundamental component of an airline's operating expenses, typically accounting for 20% to 30% of total costs. Unlike a road trip where a slight bump in gasoline prices can be absorbed, a sustained spike in jet fuel prices forces carriers to make difficult financial decisions, which often manifest as higher fares or fuel surcharges for consumers.
We take an in-depth look at the data and break down how aircraft fuel burn and geography determine the impact on your wallet.
The New Math of Flight: Gallons Per Mile
• Regional Jets (e.g., Embraer E175): While essential for short connections and feeding hub airports, smaller regional jets burn approximately 1.0 gallon of fuel per mile. Because they carry fewer passengers (typically around 76), their overall footprint is smaller, though they don't benefit from the massive economies of scale seen on larger jets.
• Narrowbody Workhorses (e.g., Boeing 737 MAX 8, Airbus A320neo): The backbone of domestic and short-haul international travel, these new-generation aircraft are designed to balance size and efficiency. A Boeing 737 MAX 8 burns about 1.6 gallons per mile, while the comparable Airbus A320neo burns roughly 1.5 gallons per mile.
• Widebody Leaders (e.g., Boeing 787-9 Dreamliner): On long-haul international routes, massive aircraft are required to carry both hundreds of passengers and the fuel needed to cross oceans. A Boeing 787-9 Dreamliner consumes significantly more fuel overall, burning approximately 3.8 gallons per mile. However, because it can transport nearly 300 passengers, its advanced composite materials and engines make it a highly efficient workhorse for global routes.
When fuel prices rise, the absolute cost of operating these aircraft jumps significantly, and those costs are inevitably passed down to the specific routes they serve.
Route Analysis: NYC to the World
To make the abstract numbers concrete, let's examine the fuel impact on three popular routes departing from New York City (NYC), comparing a "Base" fuel price of $2.50/gallon to a "High" price of $3.50/gallon.
To show what this actually means for the traveler, we've factored in the estimated average number of passengers on each flight to reveal the hidden "fuel surcharge" that gets baked into your ticket.
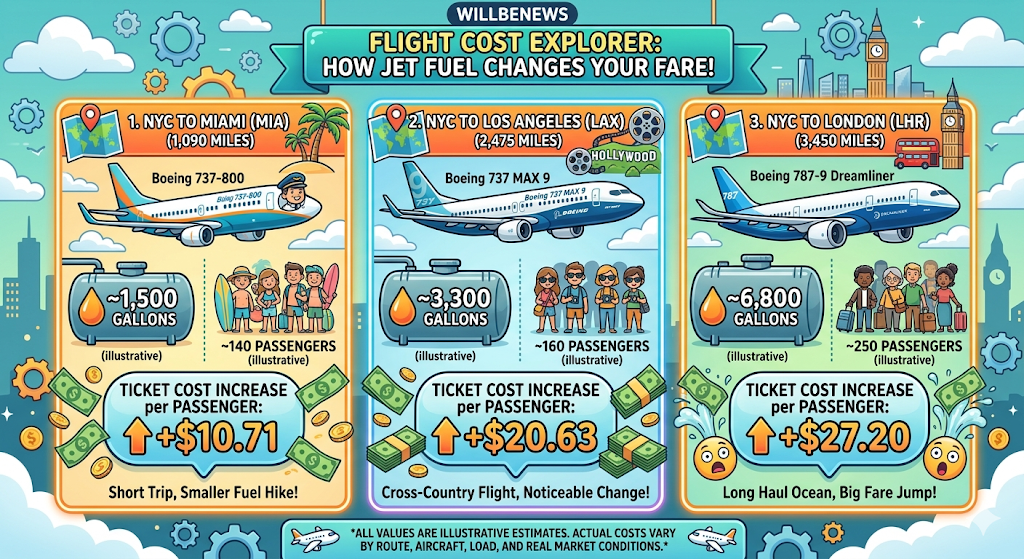
• JFK to MIA: On this popular short-haul route, a 40% increase in the fuel bill jumps the total flight energy cost by $1,500. Spread across an estimated 140 passengers, the airline needs to recover roughly $10.71 per ticket just to break even on the fuel spike.
• JFK to LAX: This cross-country trek sees a major absolute cost shift. An additional $3,300 in fuel expenses per flight translates to an increased burden of over $20 per passenger. Airlines have little choice but to adjust fares or cut amenities on transcontinental routes to maintain profitability.
• JFK to LHR: Long-haul international routes burn the most fuel. While the 787 is highly advanced, the sheer volume of fuel required (6,800 gallons) means the total fuel cost spikes by $6,800 per flight when prices hit $3.50 a gallon. Even when dividing that cost among 250 passengers, the per-ticket impact is a hefty $27.20. This is precisely why international travelers often see dynamic "fuel surcharges" that rise and fall with the market.
Looking Ahead
Surging jet fuel prices are a clear signal that the era of ultra-cheap air travel faces headwinds. While airlines work to optimize networks and deploy modern aircraft that burn fewer gallons per mile, the fundamental reality is that energy remains their largest controllable cost. For consumers, the takeaway is simple: when filling up your car costs more, expect your next flight to follow suit.
Disclaimer: All values, fuel burn rates (gallons per mile), average passenger counts, and percentages presented are illustrative estimates. Actual fuel consumption and passenger loads vary significantly by specific aircraft configuration, seasonal demand, weather conditions, and route.